Tracing
tracing is used to record the internal processes of Rspack compilation, which can be used for performance analysis as well as narrow down the location of a bug.
Enabling tracing
Tracing can be enabled in two ways:
- If using @rspack/cli or Rsbuild: Enable it by setting the
RSPACK_PROFILEenvironment variable:
- If directly using
@rspack/core: Enable it throughrspack.experiments.globalTrace.registerandrspack.experiments.globalTrace.cleanup. You can check how we implementRSPACK_PROFILEin@rspack/clifor more information.
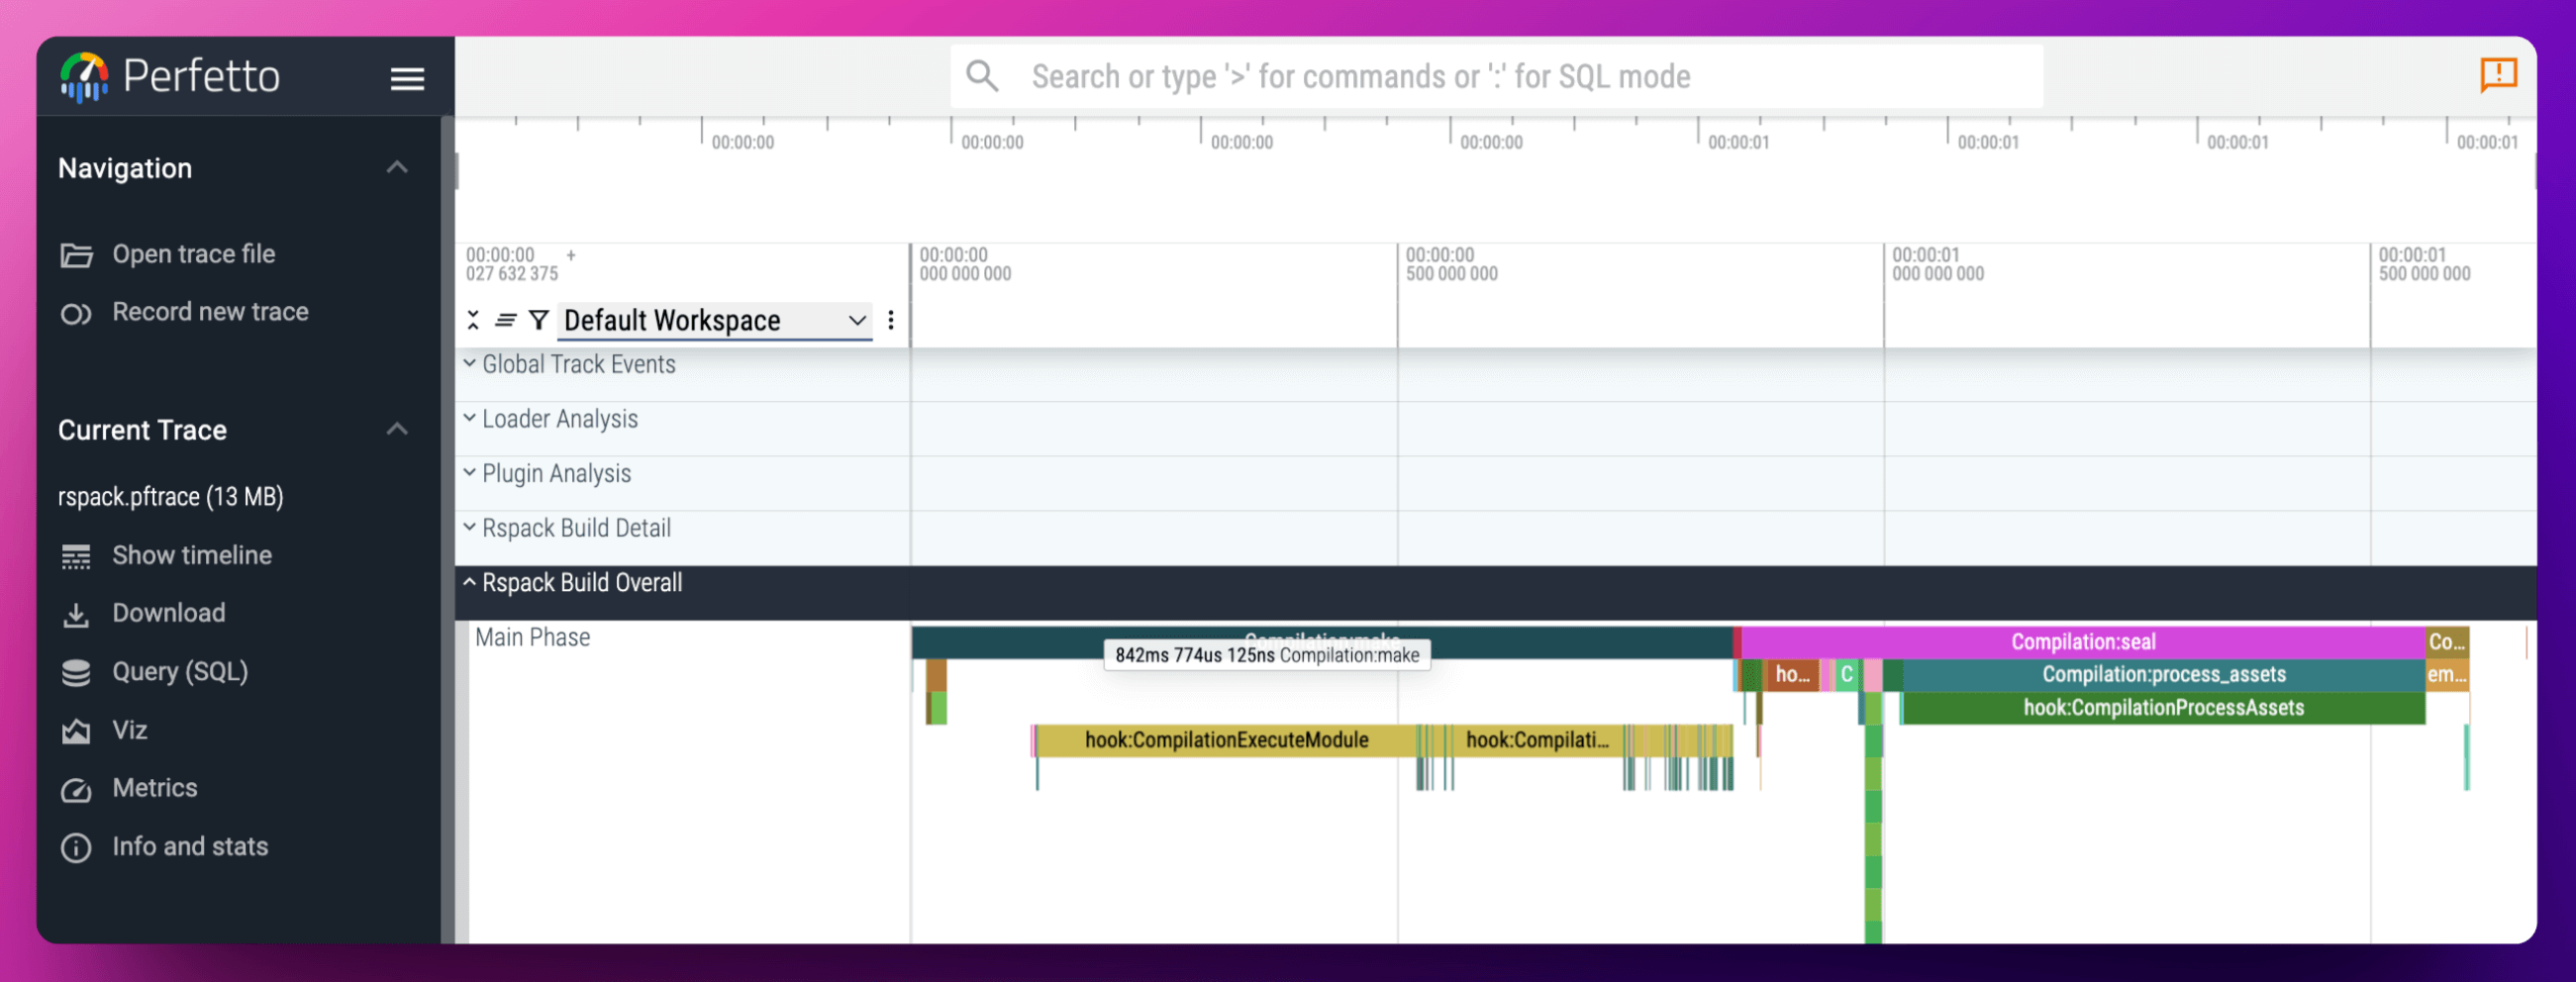
The generated rspack.pftrace file can be viewed and analyzed in ui.perfetto.dev:
Tracing layer
Rspack supports two types of layers: perfetto and logger:
perfetto: The default value, generates a rspack.pftrace file conforming to theperfetto protoformat, which can be exported to perfetto for complex performance analysislogger: Outputs logs directly to the terminal, suitable for simple log analysis or viewing compilation processes in CI environments
You can specify the layer through the RSPACK_TRACE_LAYER environment variable:
Tracing output
You can specify the output location for traces:
- The default output for the
loggerlayer isstdout - The default output for the
perfettolayer isrspack.pftrace
You can customize the output location through the RSPACK_TRACE_OUTPUT environment variable:
Tracing filter
You can configure the data to be filtered through RSPACK_PROFILE. Rspack provides two preset options:
RSPACK_PROFILE=OVERVIEW: The default value, only shows the core build process, generating a smaller JSON fileRSPACK_PROFILE=ALL: Includes all trace events, used for more complex analysis, generating a larger JSON file
Apart from the presets, other strings will be passed directly to Env Filter, supporting more complex filtering strategies:
Tracing level filter
The supported tracing levels are: TRACE, DEBUG, INFO, WARN, and ERROR. You can filter by level:
Module level filtering
Mixed filtering
EnvFilter supports mixed use of multiple filtering conditions to implement more complex filtering strategies: